

Manchester United PLC (MANU, Financial) experienced a daily loss of -12.01%, with a 3-month loss of -12.94%. The company's Loss Per Share stands at 0.71. But is the stock fairly valued? Let's explore its valuation to answer this question.
Company Introduction
Manchester United PLC operates a professional football club alongside related and ancillary activities. The company manages the Manchester United Football Club, which includes the media network, foundation, fan zone, news, sports features, and team merchandise. The majority of the revenue is generated from three principal sectors: Commercial, Broadcasting, and Matchday.

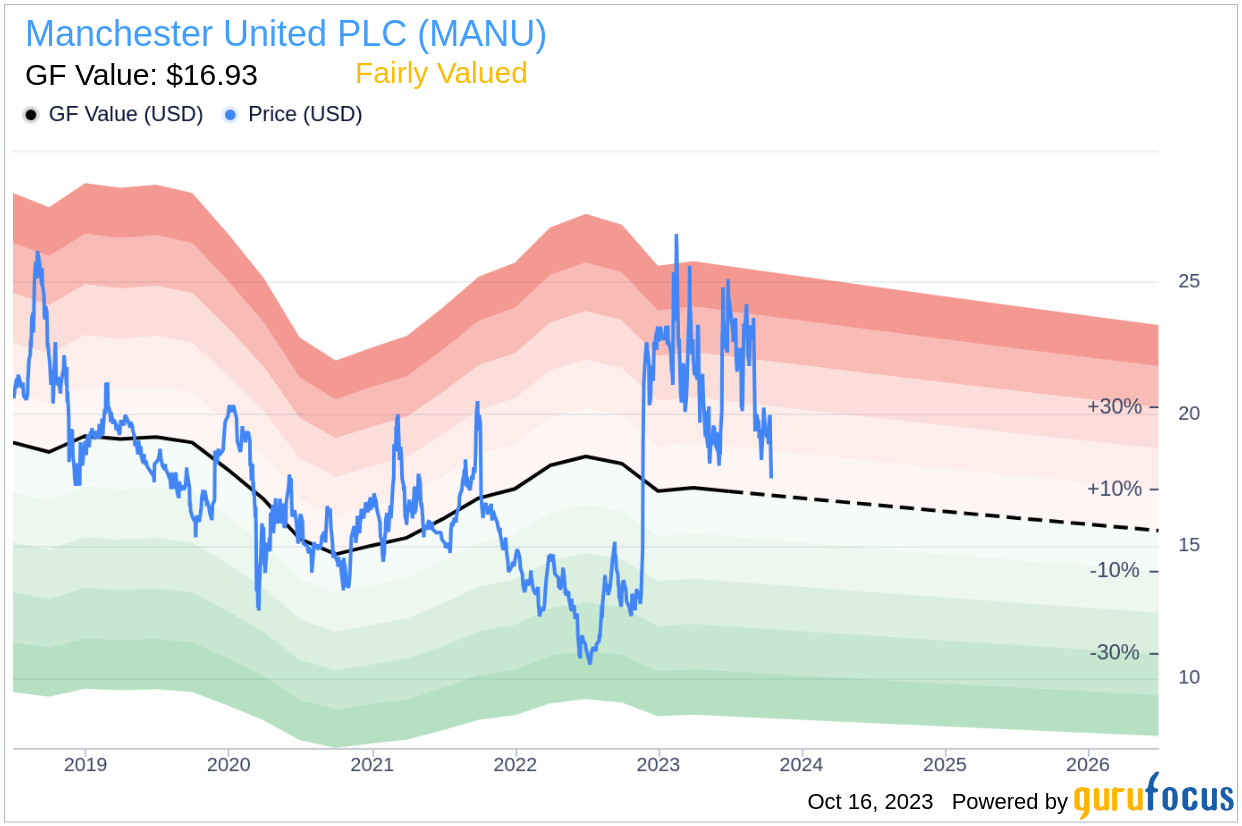
GF Value of Manchester United PLC (MANU, Financial)
The GF Value is a proprietary measure of a stock's intrinsic value, computed considering historical trading multiples, a GuruFocus adjustment factor based on past performance and growth, and future business performance estimates. The GF Value Line denotes the stock's ideal fair trading value.
Our analysis indicates that Manchester United PLC (MANU, Financial) is fairly valued. The GF Value estimates the stock's fair value at $16.93 per share, while the current stock price is $17.58. With a market cap of $2.90 billion, the stock appears to be trading at its fair value.
Because Manchester United PLC is fairly valued, the long-term return of its stock is likely to be close to the rate of its business growth.
These companies may deliver higher future returns at reduced risk.
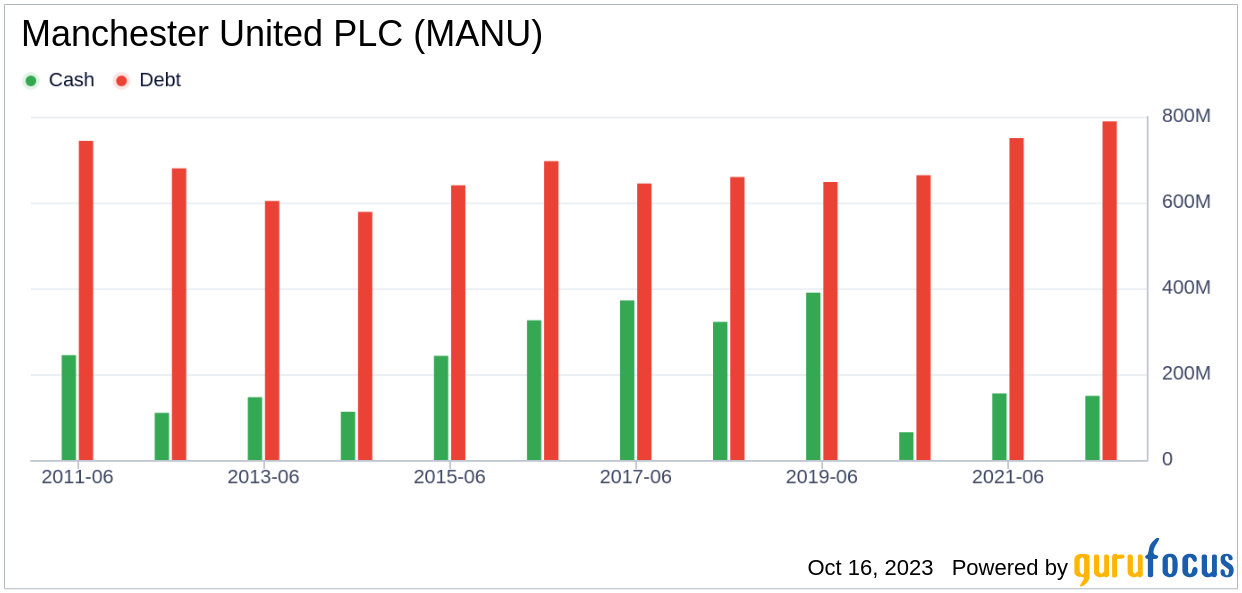
Financial Strength of Manchester United PLC
Companies with poor financial strength offer investors a high risk of permanent capital loss. To avoid permanent capital loss, an investor must do their research and review a company's financial strength before deciding to purchase shares. Both the cash-to-debt ratio and interest coverage of a company are a great way to understand its financial strength. Manchester United PLC has a cash-to-debt ratio of 0.1, which ranks worse than 84.33% of 1002 companies in the Media - Diversified industry. The overall financial strength of Manchester United PLC is 4 out of 10, which indicates that the financial strength of Manchester United PLC is poor.
Profitability and Growth of Manchester United PLC
Companies that have been consistently profitable over the long term offer less risk for investors who may want to purchase shares. Higher profit margins usually dictate a better investment compared to a company with lower profit margins. Manchester United PLC has been profitable 5 over the past 10 years. Over the past twelve months, the company had a revenue of $718.80 million and Loss Per Share of $0.71. Its operating margin is -12.9%, which ranks worse than 76.5% of 1030 companies in the Media - Diversified industry. Overall, the profitability of Manchester United PLC is ranked 5 out of 10, which indicates fair profitability.
Growth is probably the most important factor in the valuation of a company. GuruFocus research has found that growth is closely correlated with the long term stock performance of a company. A faster growing company creates more value for shareholders, especially if the growth is profitable. The 3-year average annual revenue growth of Manchester United PLC is -3%, which ranks worse than 57.47% of 950 companies in the Media - Diversified industry. The 3-year average EBITDA growth rate is -40.1%, which ranks worse than 91.51% of 766 companies in the Media - Diversified industry.
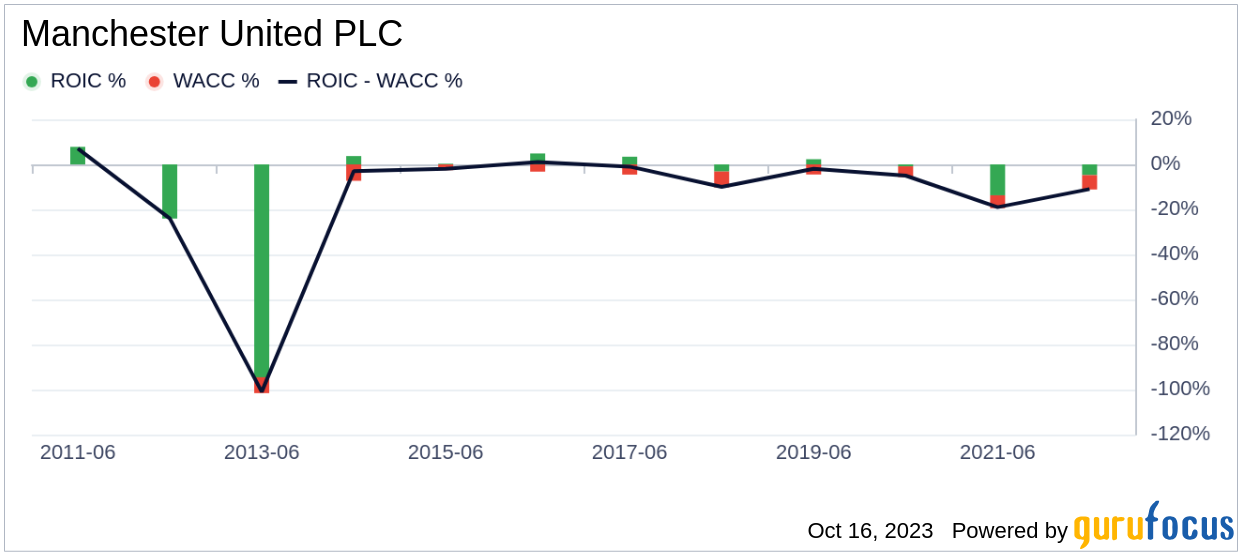
Another way to look at the profitability of a company is to compare its return on invested capital and the weighted cost of capital. Return on invested capital (ROIC) measures how well a company generates cash flow relative to the capital it has invested in its business. The weighted average cost of capital (WACC) is the rate that a company is expected to pay on average to all its security holders to finance its assets. We want to have the return on invested capital higher than the weighted cost of capital. For the past 12 months, Manchester United PLC's return on invested capital is -4.14, and its cost of capital is 7.95.
Conclusion
Overall, Manchester United PLC (MANU, Financial) stock gives every indication of being fairly valued. The company's financial condition is poor and its profitability is fair. Its growth ranks worse than 91.51% of 766 companies in the Media - Diversified industry. To learn more about Manchester United PLC stock, you can check out its 30-Year Financials here.
To find out the high quality companies that may deliver above average returns, please check out GuruFocus High Quality Low Capex Screener.
This article, generated by GuruFocus, is designed to provide general insights and is not tailored financial advice. Our commentary is rooted in historical data and analyst projections, utilizing an impartial methodology, and is not intended to serve as specific investment guidance. It does not formulate a recommendation to purchase or divest any stock and does not consider individual investment objectives or financial circumstances. Our objective is to deliver long-term, fundamental data-driven analysis. Be aware that our analysis might not incorporate the most recent, price-sensitive company announcements or qualitative information. GuruFocus holds no position in the stocks mentioned herein.